LinkedIn Long-Form Post | DM DASHBOARD

Your marketing dashboard has the wrong data on it.
Open it right now. I’m betting you see something like this:
A bar chart ranking your channels by lead volume. Paid search on top, events right behind it, some version of “organic” at the bottom. It likely tells you where forms got filled out. But, it does not tell you where decisions got made.
A doughnut chart of your spend allocation that looks almost identical to the lead chart, because you keep funding whatever produced the most last-touch leads last quarter. Tells you where money went. Does not tell you if it worked.
A line graph of page views climbing steadily to the right. This is the chart everyone screenshots for the board deck because it is the only number that never looks bad. Tells you traffic went up. Does not tell you if any of it was a buyer.
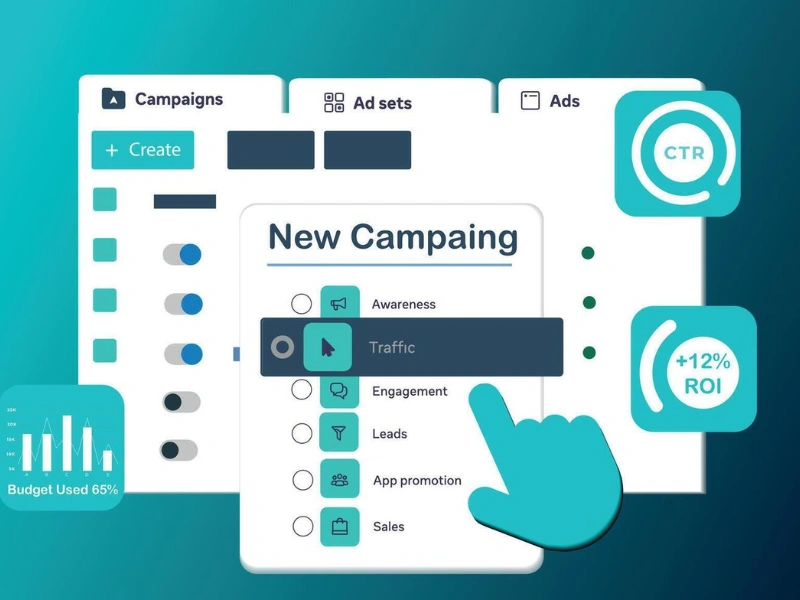
I mocked up both versions so you can see the difference. Swipe through the carousel below. Slide one is the dashboard most companies have. Slide two is the one they need.
Of all your charts, how many tie to revenue influence? And how many are there because they make the Tuesday meeting feel productive?
Here is the part that should concern you.
A decade ago, the research said buyers were roughly halfway through their decision before they ever talked to a vendor. That number has climbed every year since. Today, 73% of the B2B buying journey happens before a buyer ever identifies themselves to you. You get barely a quarter of the journey. And the invisible majority is self-directed, happening in private Slack channels, AI search tools, peer conversations, and review platforms that your attribution will never see.
83% of buyers fully define their purchase requirements before talking to sales. 60% are using AI tools like ChatGPT and Perplexity to build their vendor shortlists before any human engagement. 92% start their journey with at least one vendor already in mind.
Your dashboard cannot see where the buying journey is actually happening. So it tells you to keep funding the slice it can measure.
It is not showing you the buyer who spent three months reading your blog before a customer introduced them at a conference. Not the CTO who asked ChatGPT to compare six platforms and your name did not come up. Not the buying committee of 12 people who were passing your competitor’s white paper around a private Slack channel while your paid search ads were generating leads that would never close.
Start digging, ask your team which leads are actually converting. It’s likely channels not present or barely showing on your charts.
Here is what I would put on a dashboard:
- Pipeline influence by channel, instead of last-touch attribution. Multi-touch, weighted across every touchpoint that shaped the deal.
- Self-reported attribution alongside system attribution. Ask buyers how they actually found you. Your focus will change.
- Account-level engagement, rather than individual lead scores. With buying committees averaging 12 to 14 stakeholders, you need to see how many people in a target account are engaging, and across how many channels.
- Pipeline velocity. Not just how much pipeline you have, but how fast it moves. A full funnel that does not move is backlog.
- Content-influenced pipeline. Not “content generated this lead” but “content touched this deal at any point before close.”
- AI search visibility. Your positioning needs to surface in AI-generated answers when buyers ask about your category. Leads from AI search are converting 40% better than traditional search because buyers arrive with third-party credibility already baked in.
- Cost per SQL, not cost per lead. A $42 cost per lead means nothing if it takes $1,200 of sales time to disqualify it.
- Sales cycle length by lead source. The channels producing your fastest closes are telling you where real demand lives.
I built a HubSpot guide with these fields and views so you do not have to start from scratch. Download it at techfluency.biz/dashboard-template